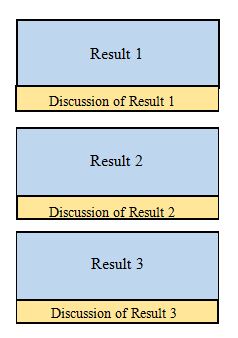
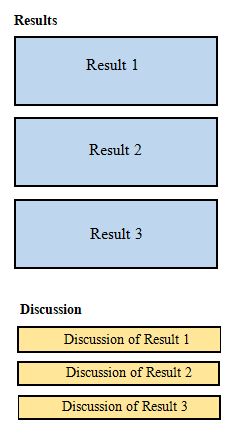
In some articles the Results and Discussion are in a single section; in others Results is in a separate section from Discussion, and in others the Results are separate but the Discussion and Conclusion are combined. These different formats don’t really affect the way the information that you need to present. You will always need Results, Discussion and Conclusion.
Results and Discussion OR


Results
Results tend to be the least troublesome in terms of writing as this is where you present your data. Your time will be taken up in creating figures and tables to present the data. Writing consists of summarizing the key points in the figures.
Trick #1: SUMMARIZE the data; don’t go through all it. Summarize it in a way that the reader will not need to look at the figure in order to get the key points.
Trick #2: Use the formulaic linguistic structures to refer the reader to the figure. There is no need to be creative. “As shown in Figure 1” or “Figure 1 shows” are perfectly satisfactory to use throughout your paper.
Discussion
The discussion is where many scientific writers have the most problem. Maybe you’re not a salesperson, but think of yourself as one when you write the discussion. You may know what’s cool about your results, but you need to sell it to the reader. You need to help us see what’s important too. It’s very useful to have an outsider read your ‘discussion’ to see if it is actually noticeable.
You don’t need to discuss at length; sometimes one sentence is enough. The discussion is really an evaluation of the results. It is a clear statement as to whether the results are
- important,
- *significant, (Note: this word has a specific meaning in statistics see this explanation)
- controversial,
- preliminary or
- supportive of what is already known.
A discussion may use citations to help you position your results in the context of the results of others.