Journal metrics measure, compare, and often rank research and scholarly publications. They can also be referred to as journal rankings, journal importance, or a journal’s impact. Journal metrics allow scholars and researchers to compare scholarly periodicals.
Each journal ranking metric uses its own formula to determine a journal’s importance to the research community. Many include counting the number of times the journal has been cited in other works. The differing formulas and methodology mean the results will differ from metric to metric. For example, an Eigenfactor score takes into consideration the size of the journal, allowing larger journals more weight, while other metrics do not take this into account. Comparing results from more than one metric will provide a better picture of the real impact of a journal.
Journal Metrics:
Eigenfactor Score
Eigenfactor Score is a ranking that measures the number of times articles from the journal published in the past five years have been cited in the JCR year.
Eigenfactor score considers the “importance” of incoming citations, with citations from highly cited journals have more influence than those from lesser cited journals.
With Eigenfactor Scores, references from one article in a journal to another article from the same journal are removed (journal self-citation is excluded).
Article influence score normalizes the Eigenfactor Score according to the cumulative size of the cited journal across the prior five years.
Available on Eigenfactor website.
SJR (SCImago Journal & Country Rank)
SCImago Journal & Country Rank is an open-source ranking database that ranks journals on their influence in the academic world as well as countries by their academic output. This metric attempts to normalize for differences in citation behavior between subject fields. See a detailed description of SJR. Based on Scopus data with a 3-year citation window.
Available on SCImago Journal and Country Rank website or via Scopus.
SNIP (Source Normalized Impact per Paper)
SNIP, or source normalized impact per publication, is a contextual citation ranking method developed by Henk Moed at the Centre for Science and Technology Studies (CTWS), University of Leiden. Using Scopus data with a 3-year citation window, citations are normalized to correct for differences in different subject fields.
Available on CWTS Journal Indicators website, or via Scopus.
CiteScore Metrics
CiteScore is the Scopus alternative to Impact Factor. a metric for measuring journal impact in Scopus.
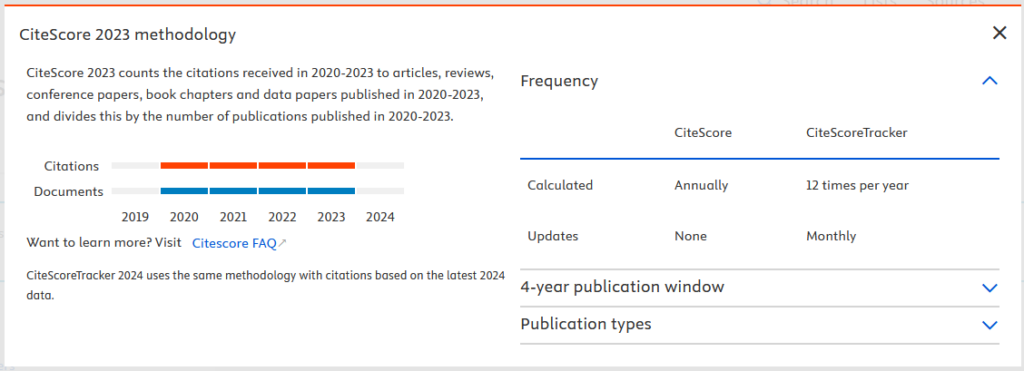
CiteScore Tracker is calculated in the same way as CiteScore, but for the current year rather than previous, complete years.
The CiteScore Tracker calculation is updated every month, as a current indication of a title’s performance.
The numerator (citation count) of the current year’s metric builds up every month as additional citations are received, so that the construction is consistent with the construction of the complete year CiteScore. CiteScore Tracker is not based on a rolling 12-month window.
The metric values are fixed around springtime, then the Tracker is calculated for the subsequent year. For example, CiteScore Tracker 2020 will be complete and fixed around May 2021, when CiteScore Tracker 2021 will start to be displayed in Scopus.com.
CiteScore Percentile indicates how a journal ranks relative to other journals in the same subject field. (The fields are defined according to the Scopus field definitions).
Available via Scopus.
h-index for Journals
A journal has an h-index of h if there is at least h papers published in that journal that have received at least h citations each.
The calculation of the H-index is not dependent on the defined citation window. If the H-index is calculated for the whole lifetime of a journal, it favors journals that have been established a long time ago. For most uses such a journal H-index does not seem useful. Instead, one must decide on the most suitable citation window. An advantage of using the H-index instead of the Impact Factor for evaluating journals is that the impact gap between multidisciplinary journals, such as Nature and Science, and other journals is significantly reduced making comparisons meaningful between these journals. Additionally, the impact of journals specializing in review articles is inherently deflated because of the limited number of annual articles in such journals.
The h-index is an alternative to the IF when evaluating the impact of journals based on citation information. It gives a rough estimate on the productivity of a journal over a long time period. The good qualities of the h-index, compared with IF, are its stability and its balanced combining of quantity and quality, which reduces the over-valuing of journals that publish review articles. Because the h-index is not based on the average number of article citations, it is not influenced by the fact that a few articles might have massive amounts of citations. However, the amount of articles a journal has published will affect somewhat the h-index score. A journal that publishes many articles will most likely get a higher h-index score than a journal that does not publish as much, because each article is a potential subject for citing. A journal that does not publish many articles will probably not get a high h-index score even if most of its articles were to be widely cited. The h-index is not calculated for one specific fixed time period like the IF, but it can be calculated for whatever time period you want, for example, for one or five years. This allows comparisons of journals that differ from each other in terms of how fast the journals start getting citations. However, even with the h-index, it is still preferable to compare journals from within the same discipline.
Publish or Perish calculates the h-index of journals using citation data from Google Scholar. This opens up the possibility of evaluating the impact of a journal that is not part of the Thomson Reuters’ Web of Science database, and therefore has no IF score. Since Google Scholar has wider ranging reference data than the Web of Science, it is able to give a fairer evaluation to journals that are cited mainly in sources outside the Web of Science, like books and journals that are not included in the Web of Science. In addition the h-index for journals is available on the SCImago Journal & Country Rank website.
Available via free software Publish or Perish, SCImago Journal & Country Rank website, or via Scopus.
g-index for Journals
The G-index is an improvement of the H-index. Egghe consideres it a drawback of the H-index that it does not take into account the citation scores of the top articles (defining h). Once articles belong to the top class it is totally unimportant whether or not they continue to be cited or not and, if cited, it is unimportant how many citations they receive. The G-index overcomes this disadvantage while keeping all advantages of the H-index and the calculation of the G-index is also as simple as the one of the H-index. The higher the number of citations in the top class that skew the citation distribution, the higher the G-score. The variance of the g-indexes of researchers will be much higher than the one of the h-indexes which makes a comparison between authors concerning their visibility in the world more apparent.
Available via free software Publish or Perish.
Google Scholar Metrics
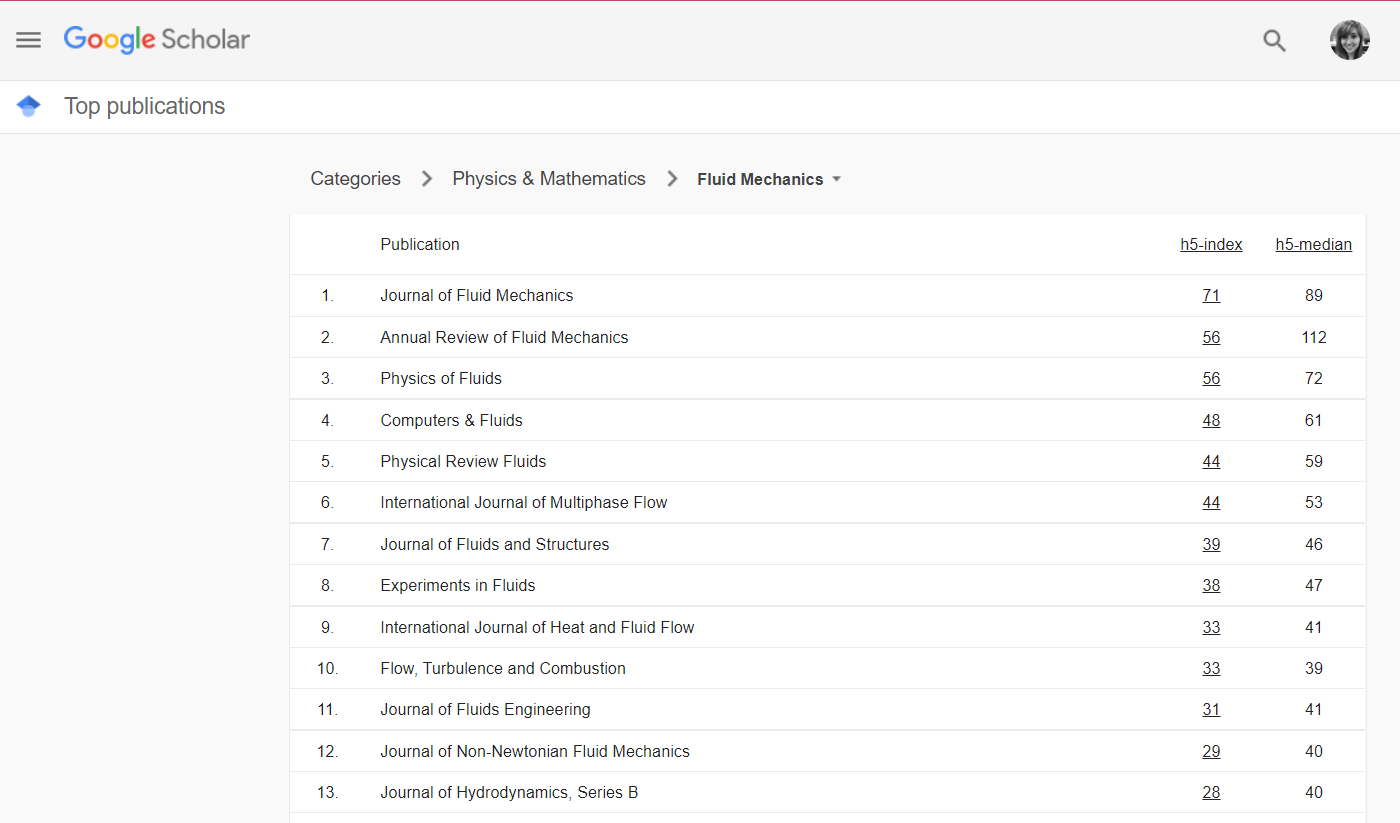
Google Scholar Metrics provide an easy way for authors to quickly gauge the visibility and influence of recent articles in scholarly publications.
Based on citations for all articles indexed in Google Scholar, it ranks journals grouped by subject categories or language. The metrics used are:
The h-index of a publication is the largest number h such that at least h articles in that publication were cited at least h times each. For example, a publication with five articles cited by, respectively, 17, 9, 6, 3, and 2, has the h-index of 3.
The h-core of a publication is a set of top cited h articles from the publication. These are the articles that the h-index is based on. For example, the publication above has the h-core with three articles, those cited by 17, 9, and 6.
The h-median of a publication is the median of the citation counts in its h-core. For example, the h-median of the publication above is 9. The h-median is a measure of the distribution of citations to the articles in the h-core.
Finally, the h5-index, h5-core, and h5-median of a publication are, respectively, the h-index, h-core, and h-median of only those of its articles that were published in the last five complete calendar years.
Available via Google Scholar.
Challenges of Journal Metrics
While journal metrics are widely used in the academic and research community, they are not without controversy. These are a few articles for further reading that discuss some of the issues and challenges of measuring journal impact.
Articles
- Callaway, E. (2016). Beat it, impact factor! Publishing elite turns against controversial metric. Nature, 535(7611), 210-211. https://doi.org/10.1038/nature.2016.20224
- Chang, C., McAleer, M., Oxley, L. (2013). Coercive journal self citations, impact factor, Journal Influence and Article Influence. Mathematics and Computers in Simulation, 93, 190-197. https://doi.org/10.1016/j.matcom.2013.04.006
- Chorus, C., & Waltman, L. (2016). A Large-Scale Analysis of Impact Factor Biased Journal Self-Citations. Plos ONE, 11(8), 1-11. https://doi.org/10.1371/journal.pone.0161021
- Lozano, G. A., Larivière, V., & Gingras, Y. (2012). The weakening relationship between the impact factor and papers’ citations in the digital age. Journal Of The American Society For Information Science & Technology, 63(11), 2140-2145.https://doi.org/10.1
- Zhang, L., Rousseau, R., & Sivertsen, G. (2017). Science deserves to be judged by its contents, not by its wrapping: Revisiting Seglen’s work on journal impact and research evaluation. Plos ONE, 12(3), 1-18. https://doi.org/10.1371/journal.pone.0174205